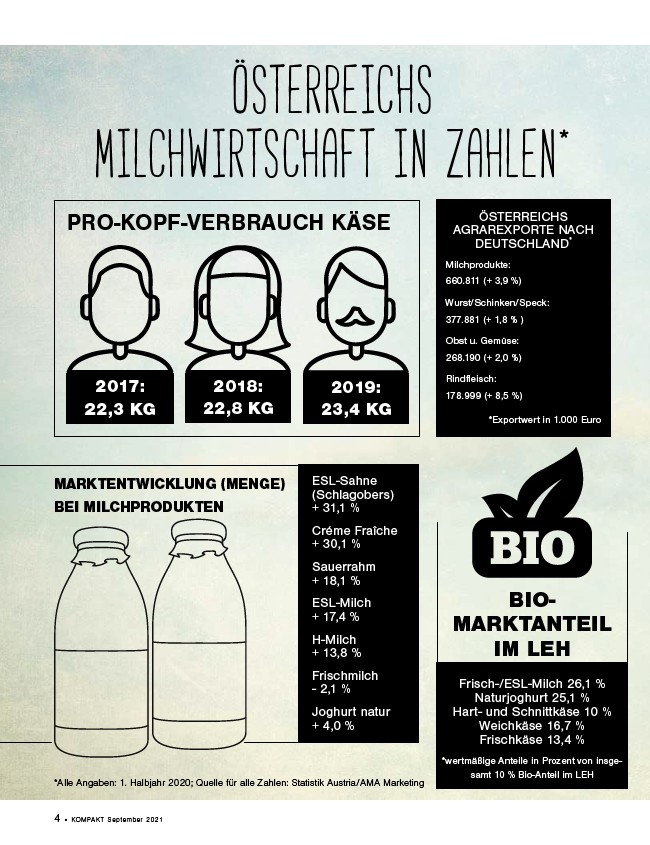
2019:
23,4 KG
*Alle Angaben: 1. Halbjahr 2020; Quelle für alle Zahlen: Statistik Austria/AMA Marketing
4 • KOMPAKT S eptember 2021
Österreichs
Milchwirtschaft in Zahlen*
PRO-KOPF-VERBRAUCH KÄSE
MARKTENTWICKLUNG (MENGE)
BEI MILCHPRODUKTEN
ESL-Sahne
(Schlagobers)
+ 31,1 %
Créme Fraîche
+ 30,1 %
Sauerrahm
+ 18,1 %
ESL-Milch
+ 17,4 %
H-Milch
+ 13,8 %
Frischmilch
- 2,1 %
Joghurt natur
+ 4,0 %
2018:
22,8 KG
2017:
22,3 KG
ÖSTERREICHS
AGRAREXPORTE NACH
DEUTSCHLAND*
Milchprodukte:
660.811 (+ 3,9 %)
Wurst/Schinken/Speck:
377.881 (+ 1,8 % )
Obst u. Gemüse:
268.190 (+ 2,0 %)
Rindfleisch:
178.999 (+ 8,5 %)
*Exportwert in 1.000 Euro
BIO-
MARKTANTEIL
IM LEH
Frisch-/ESL-Milch 26,1 %
Naturjoghurt 25,1 %
Hart- und Schnittkäse 10 %
Weichkäse 16,7 %
Frischkäse 13,4 %
*wertmäßige Anteile in Prozent von insgesamt
10 % Bio-Anteil im LEH